Karnaugh Map
The Karnaugh map, or K-map, was invented by Maurice Karnaugh and published in 1953.1. Computer engineers make use of Karnaugh maps to simplify combinational logic circuits using pattern recognition techniques. In the information technology discipline, it is useful to be able to recognize Karnaugh maps and understand that they convey the same information as a truth table.
Video Lecture
Purpose and Structure
A Karnaugh (pronounced “car-nah”) map provides a more compact way to represent the information in a truth table. When designing circuits, it is possible for an engineer to recognize patterns in this type of map and simplify the design based on those patterns. For our purposes, it is sufficient to be able to recognize a Karnaugh map and relate it to the data in a truth table.
The main difference between a Karnaugh map and a truth table is that a Karnaugh map groups inputs together in two dimensions of a grid, placing the output(s) in the grid cells. The inputs are ordered using Gray Code on each axis. Using Gray Code means that only 1 input changes when moving between cells within the table vertically or horizontally.
Inputs are grouped together and divided on the horizontal and vertical axes of the table. Typically, computer engineers divide the inputs roughly in half, with the first half of the inputs written horizontally across the table and the second half written vertically. However, a Karnaugh Map can also be written with the first group of inputs arranged vertically and the second group arranged horizontally, as is found in Karnaugh’s original paper on the subject.1
The output produced by the circuit for the corresponding combination of inputs is placed into each grid cell. Whenever a circuit outputs multiple values, these values can be grouped together to form a binary number with one digit for each output. These numbers are then placed into the grid cells. In other words, the output of a circuit represented by a Karnaugh map isn’t limited to a single digit (0 or 1). This output could have multiple digits, like 01, 10, 100, 1001, etc.
Since a Karnaugh Map contains the same information as a truth table, it is possible to trace a circuit directly into a Karnaugh Map. However, for a circuit small enough to trace by hand, it may be easier to create a truth table first and then translate it into a K-Map. This process is illustrated in the following example.
Example
Let’s start with the circuit shown in Figure 1. This circuit is (A+B)·(C+D).
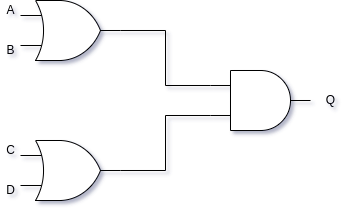
We can trace this circuit to create the truth table shown in Table 1. Notice that the output is only 1 whenever at least one of A or B, and at least one of C or D, is 1. On any row where both A and B or zero, and/or both C and D are zero, the output is 0. We expect this behavior from the circuit, since the output of an AND gate is always zero if either (or both) of its inputs is/are zero. The OR gates that feed the AND gate can only produce an output of 1 if at least one of their inputs is 1. Refer back to Common Gates as needed.
| A | B | C | D | Q |
|---|---|---|---|---|
| 0 | 0 | 0 | 0 | 0 |
| 0 | 0 | 0 | 1 | 0 |
| 0 | 0 | 1 | 0 | 0 |
| 0 | 0 | 1 | 1 | 0 |
| 0 | 1 | 0 | 0 | 0 |
| 0 | 1 | 0 | 1 | 1 |
| 0 | 1 | 1 | 0 | 1 |
| 0 | 1 | 1 | 1 | 1 |
| 1 | 0 | 0 | 0 | 0 |
| 1 | 0 | 0 | 1 | 1 |
| 1 | 0 | 1 | 0 | 1 |
| 1 | 0 | 1 | 1 | 1 |
| 1 | 1 | 0 | 0 | 0 |
| 1 | 1 | 0 | 1 | 1 |
| 1 | 1 | 1 | 0 | 1 |
| 1 | 1 | 1 | 1 | 1 |
To create a Karnaugh map from the truth table in Table 1, we divide the inputs into two groups. Inputs A and B make up the first group, while inputs C and D are put into the second group. We use the 2-bit Gray Code to order each pair of inputs: 00, 01, 11, 10. Following the computer engineering convention, the input pairs for A and B are written across the top row of the table, while the input pairs for C and D are written down the first column of the table, as shown in Table 2.
We then consider what the combination of inputs does within the circuit in order to write the outputs into the table cells. The first output cell (second row, second column) gives the output of the circuit whenever A and B are 0, and C and D are 0. This cell corresponds to the first data row of the truth table in Table 1. Moving one cell to the right in the Karnaugh map (Table 2), we enter the output when A is 0 and B is 1, but when C and D are both still zero. The next cell to the right gives the output when A and B are both 1, but C and D are still both zero. Finally, the last cell on the right side of the first output row gives the output where A is 1 and B is 0, and C and D are both still 0. Notice that, for this row, only the values of A and B changed: C and D stayed the same (0).
As we go down the table vertically, we change the values of C and D, again following the Gray Code. Thus, on the second output row of the K-map, the first output column provides the output when A and B are both 0, but C is 0 and D is 1. We hold C=0 and D=1 for this entire row, changing the values for A and B just like we did for the first data row. This approach repeats for the remaining two rows of the table.
Notice in Table 2 that our output values correspond to the same combination of inputs that we see in the truth table in Table 1. The Karnaugh map represents the same information, but it does so in a much more compact form.
| CD \ AB | 00 | 01 | 11 | 10 |
|---|---|---|---|---|
| 00 | 0 | 0 | 0 | 0 |
| 01 | 0 | 1 | 1 | 1 |
| 11 | 0 | 1 | 1 | 1 |
| 10 | 0 | 1 | 1 | 1 |
In practice, it might be a little easier to build the K-Map from the truth table by following the truth table row by row instead of looking up the rows in the truth table from the inputs on the K-Map. This approach is demonstrated in the video lecture toward the top of this page.
Reading K-Maps
It is possible for a Karnaugh Map to have different numbers of inputs from the above example. Table 3 illustrates a K-Map with two inputs.
| AB | 00 | 01 | 11 | 10 |
|---|---|---|---|---|
| 1 | 0 | 1 | 0 |
To read the Karnaugh Map in Table 3, note that the output values correspond to the different combinations of A and B. Since we only have two inputs, these combinations are grouped together across the table in Gray Code order. Whenever A and B are both zero, the output is one. When A is 0 and B is 1, the output is 0. When both inputs are 1, the output is 1. Finally, when A is 1 and B is 0, the output is 0.
The key to understanding what a circuit represented by a K-Map is doing is to look for the places where it outputs a 1. In Table 3, a 1 is output for the input combinations 00 and 11, which correspond to situations where A and B have the same value (0 or 1), or where the inputs are equivalent. Recall that the equivalence, or XNOR, gate has this property. Therefore, this particular Karnaugh Map describes either an XNOR gate or a circuit that can be replaced by a single XNOR gate.
Odd Numbers of Inputs
Suppose a circuit has an odd number of inputs. We can still construct a K-Map for it, but the number of inputs in each group will be uneven. Table 4 illustrates a Karnaugh Map with 3 inputs. The first two inputs are arranged along one of the axes (in this case, horizontally), and the third input is arranged on the other axis. Since a 1-bit Gray Code just alternates between 0 and 1, the axis for the third input only requires two labels.
| C \ AB | 00 | 01 | 11 | 10 |
|---|---|---|---|---|
| 0 | 0 | 0 | 1 | 0 |
| 1 | 1 | 1 | 1 | 1 |
If we look for the places in Table 4 where the output is 1, we can quickly identify the “11” AB column and the row where C is 1. Therefore, an output of 1 occurs whenever both A and B are both 1 or whenever C is 1. We can therefore write the output Q of our circuit to say that it is equal to the situation where (A AND B) are 1 OR C is 1. In Boolean Algebraic notation, this expression is written as Q = (A·B) + C.
More Than One Output
A circuit can have more than one output, and these outputs can be grouped together in the Karnaugh Map. Table 5 shows a K-Map with four inputs A, B, C, and D. Inputs A and B are grouped together horizontally, while inputs C and D are grouped together vertically. The two outputs Q0 and Q1 are grouped together in the data part of the table.
| CD \ AB | 00 | 01 | 11 | 10 |
|---|---|---|---|---|
| 00 | 00 | 00 | 00 | 00 |
| 01 | 00 | 01 | 01 | 00 |
| 11 | 00 | 01 | 11 | 10 |
| 10 | 00 | 00 | 10 | 10 |
To determine the logical expression represented by the K-Map in Table 5, we need to find the ones in the table as usual. However, since we have more than one output, we need to find the ones for each output individually. In this case, Q0 is the first digit of the output, and Q1 is the second digit of the output. The first digit of the output is 1 for the inputs 1111, 1110, 1011, and 1010. Looking at this pattern, we can see that inputs A and C are always 1 whenever we have a 1 for Q0. Inputs B and D can be either 0 or 1, so they are not affecting the Q0 output. Therefore, we can say that Q0 = A·C.
We repeat this process for the second output Q1. The second digit of the output is 1 for inputs 0101, 0111, 1101, and 1111. Again, we have a pattern here: the B and D inputs are both 1 whenever Q1 is 1, but inputs A and C can be either 0 or 1. Therefore, the Q1 output depends only on B and D being 1. The resulting expression is Q1 = B·D.
Taken together, the K-Map in Table 5 represents the circuit consisting of Q0 = A·C; Q1 = B·D. Since the Q0 output depends only on A and C, while the Q1 output depends only on B and D, this circuit is really comprised of two independent circuits. We could therefore decompose this Karnaugh Map into two separate maps: one for each independent part of the original circuit.
Practice Problems
Try working these problems before revealing the answers.
- What is the name for a pattern of two bits in the order: 00, 01, 11, 10? (The concept generalizes for more than two bits, but two bits is sufficient for this question.)
Show Answer
Gray Code
- What kind of table is this?
| CD \ AB | 00 | 01 | 11 | 10 |
|---|---|---|---|---|
| 00 | 1 | 1 | 1 | 0 |
| 01 | 1 | 1 | 1 | 0 |
| 11 | 1 | 1 | 1 | 0 |
| 10 | 1 | 1 | 1 | 0 |
Show Answer
Karnaugh map (or K-map, for short)
- What is the output of the circuit represented by this table whenever A=0, B=1, C=1, and D=0?
| CD \ AB | 00 | 01 | 11 | 10 |
|---|---|---|---|---|
| 00 | 1 | 1 | 1 | 0 |
| 01 | 0 | 1 | 0 | 0 |
| 11 | 1 | 1 | 1 | 0 |
| 10 | 1 | 0 | 1 | 0 |
Show Answer
The output is 0. Remember that A and B are written across the top row, so A=0 and B=1 means to look for the column labeled 01. C and D are written vertically in the first column, so C=1 and D=0 means to look at the row labeled 10.
- Create a Karnaugh Map from a circuit with the truth table:
| A | B | C | Q |
|---|---|---|---|
| 0 | 0 | 0 | 1 |
| 0 | 0 | 1 | 0 |
| 0 | 1 | 0 | 0 |
| 0 | 1 | 1 | 0 |
| 1 | 0 | 0 | 0 |
| 1 | 0 | 1 | 0 |
| 1 | 1 | 0 | 0 |
| 1 | 1 | 1 | 0 |
Show Answer
| C \ AB | 00 | 01 | 11 | 10 |
|---|---|---|---|---|
| 0 | 1 | 0 | 0 | 0 |
| 1 | 0 | 0 | 0 | 0 |
References and Further Reading
-
Maurice Karnaugh. “The Map Method for Synthesis of Combinational Logic Circuits.” Transactions of the American Institute of Electrical Engineers, Part I: Communications and Electronics 72(5): 593-599. Available from the Internet Archive ↩↩
