|
|
|
|
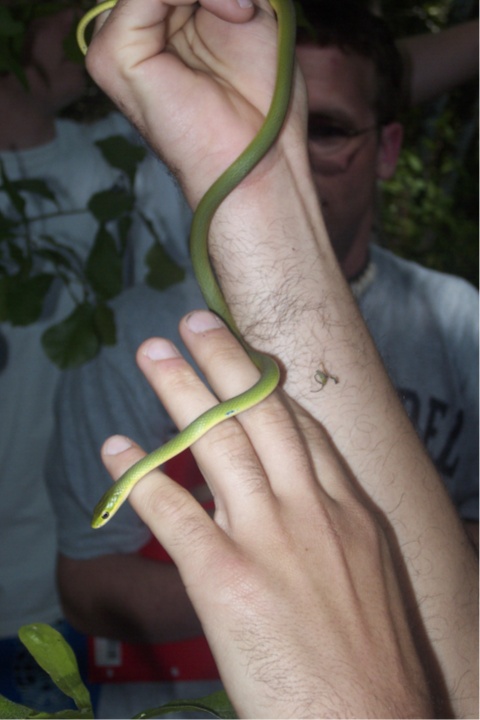
Advice about writing Ecology lab reports. Here are some brief tips for writing about statistics from Dr. Chris Hill. Follow his advice and you'll do well on your lab reports. Lab 1: Introduction to graphics and statistics. Lab 2: Analyzing variation. Bring a calculator. We'll be collecting pine needles on campus for a short while. Be prepared for rain. Lab 3: Natural history. Be sure to wear appropriate clothing for being outside walking through a forest and being potentially wet. Bring bug spray. You'll also need a pencil, and some paper or a notebook to record your observations. Lab 4: Life tables. We'll be visiting the cemetery next to the football stadium; be prepared in case of rain.
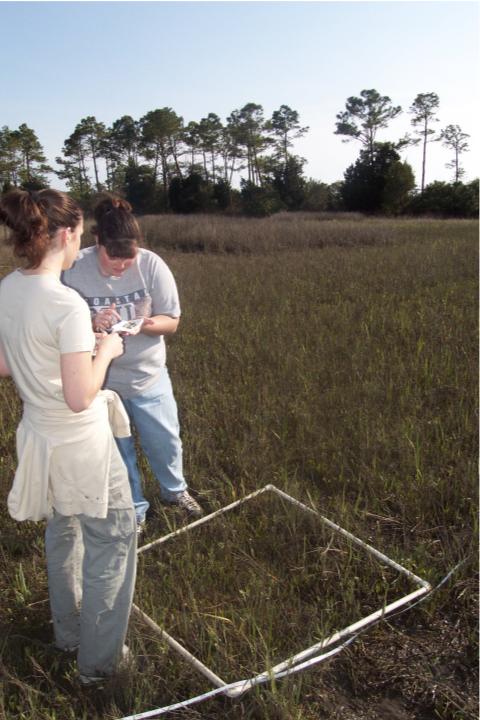
Lab 5: Spatial distribution of Ilex opaca (American Holly) and Vitis sp. (grape). Bring a calculator. Be prepared for rain as we walk in a local forest. It's sometimes 'buggy'--you may wish to bring some repellent. Lab 6: Mark-recapture experiment in the salt marsh at Waties Island. Be prepared for mud, bugs, tides, and rain. Knee-high rubber boots or other mud-shoes are helpful.
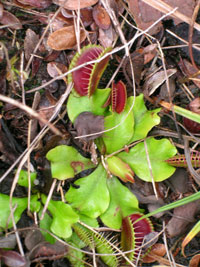
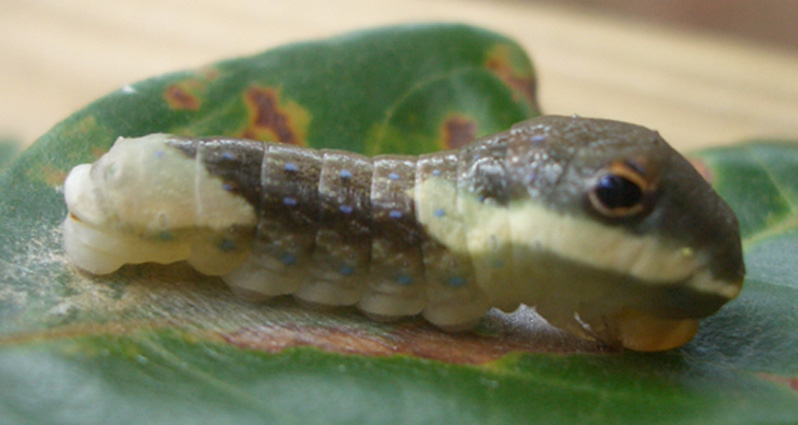
Lab 7: Gall formation on red bay. We'll be walking around campus. Be prepared for rain and bugs. If you're interested, here are some pictures of Red bay and the jumping plant louse. Lab 8: Ecotones at Lewis Ocean Bay. Come prepared to get dirty and to potentially deal with small, annoying critters as well as vines with thorns. Wear closed-top shoes (not flip-flops!). Long pants are very helpful. You are also likely to get some ashes on your clothes when you brush past trees burned during past fires. We also should see some carnivorous plants. Lab 9: Soil microarthropods. We will be collecting leaf litter on campus for a short while during the first lab. Sometimes we'll need these tables below to interpret the statistical significance of our results. Chi-square table of critical values Student's t-test table of critical values
|
|||||||||||