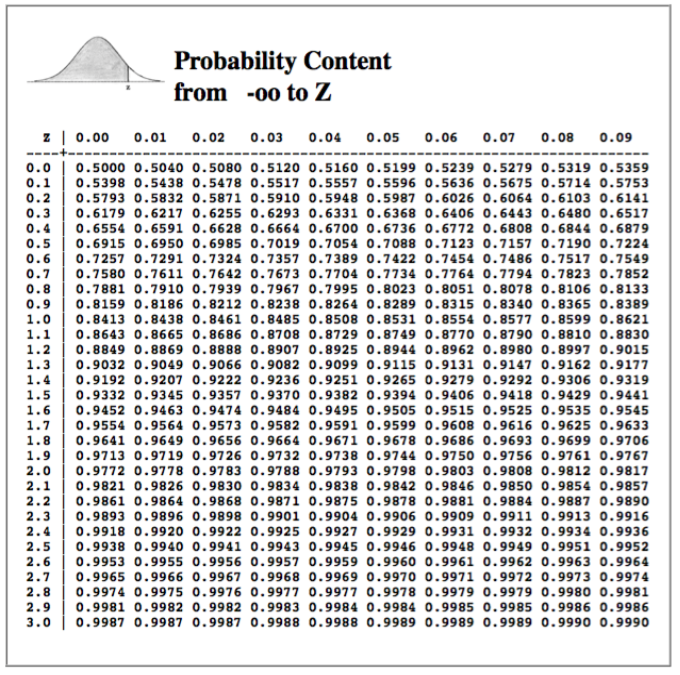
The table contains three-digit z-scores. The first two digits are in the left margin of the table, i.e., 0.0, 0.1, 0.2, all the way up to 3.0. The third digit is in the top margin of the table: 0.00, 0.01, 0.02, up to 0.09.
The values in the table are probabilities (areas under the curve) between negative infinity (the bottom of the distrubtion) and the z-score. This is what the little normal curve at upper left tells you. The probabilities in the table correspond to the shaded area under that curve.
Thus, what area (probability) lies between the bottom of the curve and z = 1.28? Start in the left margin, go down to 1.2, and then go across until you are in the column under 0.08. The answer is p = 0.8997.
Here is a slightly more difficult one. What area (probability) lies between z = 0 and z = 1.28? The normal curve is symmetrical around zero. Therefore, half the area lies below zero and half above zero. (How much area lies at exactly z = 0?) Thus, the area below zero is 0.5000, and we need to subtract that out of the area between negative infinity and 1.28. So:
p(0 <= z <= 1.28) = 0.8997 - 0.5000 = 0.3997
The notation above reads, "the probability that a z-score lies between 0 and 1.28 is 0.3997." What area lies above exactly z = 0? Zero! Above any value exactly, we do not have a "slab" of the normal distribution, we have only a line, and a line has no area (flash back to geometry). It is a peculiar property of the z-distribution that we cannot find the probability of getting any value of z exactly. We can only find probability between two different values of z. That's also true of the t-distribution, the F-distribution, the chi-square distribution, and many (but not all) others.
What z-score has 5% of the area of the normal distribution above it? Hunt through the table until you find a probability of 0.9500. You won't find it. You'll find that an area of 0.9505 corresponds to a z-score of 1.65, and an area of 0.9495 corresponds to a z-score of 1.64. We might guess, therefore, that 0.9500 lies midway between those two, or z = 1.645.
If you need more practice, there are a zillion YouTube videos.
How do you solve the problem proposed in the handout? Standardized z-scores have a standard deviation of 1.00. Thus, since we know that IQ scores of 118 and 133 span a distance of z = 1, we know that 133 - 118 = 15 is the standard deviation of the raw IQ scores.
Convert 125 and 140 to z-scores by subtracting the mean and dividing by the standard deviation. (You remember that, right?)
(125 - 118) / 15 = 0.46667 or 0.47
(140 - 118) / 15 = 1.46666 or 1.47
Get a probability from negative infinity to 1.47 from the table. It's 0.9292.
Get a probability from negative infinity to 0.47 from the table. It's 0.6808.
Now find the area between 0.47 and 1.47 by subtraction: 0.9292 - 0.6808 = 0.2484. That's the proportion of scores that lie between z-scores of 0.47 and 1.47, or between raw IQ scores of 125 and 140. (Why subtraction? It's the same idea as if you had a yard stick that is 36 inches long. How many inches of that yard stick lie between the 27-inch mark and the 33-inch mark?)
There are 9000 students altogether. A proportion of 0.2484 of them have IQs between 125 and 140. That's:
0.2484 * 9000 = 2235.6
Can you have six-tenths of a student? I hope not! Therefore, we might round off and say 2236 students. Is that exactly right? Nope! It's an estimate based on our normal model.
That will give you some idea of how powerful statistical techniques can be when we know, or can assume, that scores are normally distributed.