My first recommendation is to learn how to do this in R. Vassarstats will not work once we get to unbalanced designs. You'll have to do those in R, so there is no time like the present to learn it. But if you must...
We will use the oddmonkeys data as an example.
   successes   reward motivation
1          1      low       weak
2          4      low       weak
3          0      low       weak
4          7      low       weak
5         15      low     strong
6          6      low     strong
7         10      low     strong
8         13      low     strong
9         13 moderate       weak
10         5 moderate       weak
11         7 moderate       weak
12        15 moderate       weak
13         6 moderate     strong
14        18 moderate     strong
15         9 moderate     strong
16        15 moderate     strong
17         9     high       weak
18        16     high       weak
19        18     high       weak
20        13     high       weak
21        14     high     strong
22         7     high     strong
23         6     high     strong
24        13     high     strong
Prepare the design table with the data in each of the cells.
                                      reward
                           low       moderate      high
                  -------------------------------------------
                  |         1    |      13    |      9      |
                  |         4    |       5    |     16      |
          weak    |         0    |       7    |     18      |
                  |         7    |      15    |     13      |
motivation        -------------------------------------------
                  |        15    |       6    |     14      |
                  |         6    |      18    |      7      |
         strong   |        10    |       9    |      6      |
                  |        13    |      15    |     13      |
                  -------------------------------------------
Go to Vassarstats. This link is also at the website.
On the Vassarstats homepage, there is a menu in the blue area at the lefthand side of the page. Click ANOVA in that menu.
A menu page for analysis of variance comes up. On that menu, click Two-Way Factorial ANOVA for Independent Samples.
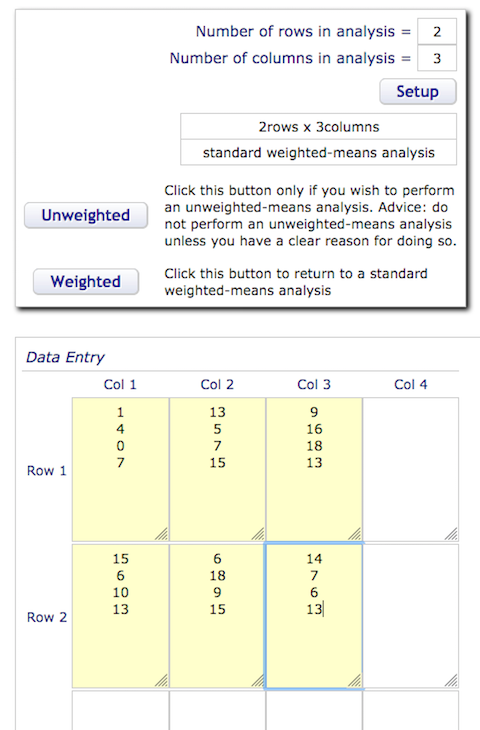
A Procedure page comes up. READ THIS PAGE CAREFULLY! Especially read very carefully the instructions about entering data. Then scroll down to the setup box and enter the number of rows (2 in our example) and columns (3 in our example) in the boxes. You will not be able to do anything larger than a 4x4 design, another reason for learning how to use R!
In the same box, you are offered a choice between an Unweighted means analysis and a Weighted means analysis. Notice that "standard weighted-means analysis" is the default. That's fine. As long as the design is balanced, both analyses give the same result anyway.
Click the Setup button. Notice that a 2x3 area of the Data Entry table has been highlighted in yellow. Enter your data into those boxes being very careful NOT to press Enter after entering the last value in a box. (See the instructions on the Procedure page if you skipped them!)
You should now be looking at this...
Scroll down a little more and click the Calculate button. Then scroll down more to see your results, which will include descriptive statistics, an ANOVA summary table, and critical values for the Tukey HSD tests. Those critical values are the smallest differences in the row marginal means, the column marginal means, and the cell means, that are staticially significant.
Congrats! That's all you can get from Vassarstats.