I can't let you get away without doing this problem!
We all know the word "lunacy" means craziness, but have you ever considered the origin of the word? It comes from the same root that words such as "luna" and "lunar" do, the Latin word "lunaticus," which means "of the moon" or sometimes "moonstruck." Lunacy is a type of madness that was at one time believed to be due to the changing phases of the moon.
It was not just madness that was believed to be related to the moon's phases, but also epilepsy, fevers, insomnia, and other disorders. In fact, this possible relationship is still being investigated today. A quick search through Google Scholar turned up an article on murder rates and the lunar cycle that was published in 2018. There is even a Wikipedia article on the so-called lunar effect (opens in a new window or tab).
Some references for the curious (all of these are freely available at Google Scholar):
A number of years ago, I had a student in this class who was a nurse in a local birthing center, and she swore up and down, when the moon was full, that the birthing center "went crazy" (meaning the number of births jumped dramatically). My response to that was bull-oney! Other students in the class protested. She was the nurse, after all, and who was I to say she was wrong? Good point!
I just happened to have a dataset that gave number of live births in the United States for every day of the year 1978 (other years are available at the Centers for Disease Control website), so we decided to add some information to that dataset and investigate the problem statistically. I didn't expect we would find anything, but many of the students did, and it's always possible that I might be wrong. (It's been known to happen!)
The dataset is at the website in a file called births78.txt. You can examine it by using the Data File Retrieval box at the website. Here is the top of it.
# births78.txt
# This dataset gives number of births in the U.S. for
# each day in the calendar year 1978. The variables are:
#   day: day of the year numbered 1-365
#   month: month of the year (Jan, Feb, Mar, etc.)
#   weekday: day of the week (Sun, Mon, Tue, etc.)
#   births: the number of live births on that day
#   holiday: coded yes for New Year's Day, Memorial Day, Independence Day,
#            Labor Day, Thanksgiving Day, and Christmas Day; otherwise no
#   wkend: coded yes for Saturdays and Sundays; otherwise no
#   fmoon: coded yes for days on which there was a full moon; otherwise no
#   dyaway: days away from full moon (crude, by simple counting)
# The data were used by Professor Geoffrey Berresford in his article: The
# uniformity assumption in the birthday problem, Math. Mag. 53 1980, no. 5,
# 286-288. Retrieved from: Chance Data Sets
# http://www.dartmouth.edu/~chance/teaching_aids/data.html
# (This website apparently no longer exists.)
#
day    month  weekday    births  holiday    wkend    fmoon  dyaway
1        Jan      Sun      7701      yes      yes       no      7
2        Jan      Mon      7527       no       no       no      8
3        Jan      Tue      8825       no       no       no      9
4        Jan      Wed      8859       no       no       no      10
5        Jan      Thu      9043       no       no       no      11
6        Jan      Fri      9208       no       no       no      12
We're not actually going to get that dataset. We're going to get a closely related dataset, in which month and weekday are coded a little differently. You'll see the point once we get the data.
> file = "http://ww2.coastal.edu/kingw/psyc480/data/births78abc.txt"
> moon = read.table(file=file, header=T, stringsAsFactors=T)
If you still have the getData() function, just say moon = getData("births78abc.txt").
It is sufficient to remember that the days of the year are listed in order in the data frame, and are also given in the row names, so "day" can be NULLed out.
> moon$day = NULL   # wasted space; get rid of it
> summary(moon)
     month      weekday       births      holiday   wkend     fmoon         dyaway
 a.Jan  : 31   a.Mon:52   Min.   : 7135   no :359   no :260   no :353   Min.   : 0.000
 c.Mar  : 31   b.Tue:52   1st Qu.: 8554   yes:  6   yes:105   yes: 12   1st Qu.: 4.000
 e.May  : 31   c.Wed:52   Median : 9218                                 Median : 8.000
 g.Jul  : 31   d.Thu:52   Mean   : 9132                                 Mean   : 7.496
 h.Aug  : 31   e.Fri:52   3rd Qu.: 9705                                 3rd Qu.:11.000
 j.Oct  : 31   f.Sat:52   Max.   :10711                                 Max.   :15.000
 (Other):179   g.Sun:53
The change in coding is most obvious when you look at weekday. Instead of being coded Mon, Tue, Wed, and so forth, weekdays are coded a.Mon, b.Tue, c.Wed, and so forth. Why would I do that? The month and weekday variables are being seen as factors, and R sees the levels of a factor in alphabetical order unless we tell it to do otherwise with the relevel() function. That would be a nuisance here because there are 12 months and 7 weekdays. There is another function that we can use to change the order in which R sees the levels, but it's just easier to make the months and weekdays occur in alphabetical order by prefixing them with a, b, c, etc. I also made Sunday the last day of the week, because I wanted to keep Saturday and Sunday together. You'll see why.
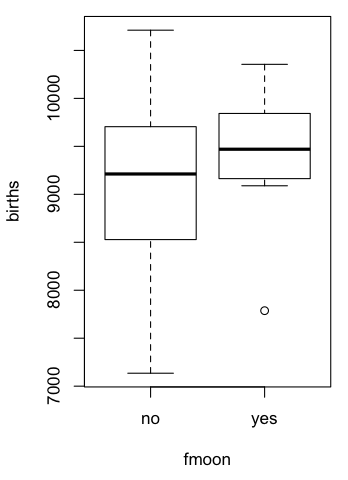
> boxplot(births ~ fmoon, data=moon)
Hmm! Interesting! Except for one low outlier, it appears that the number of births on full moon days is generally higher than it is when there is not a full moon. The median is higher and there appears to be a lot less variability as well. I'm intrigued. Let's move on to a t-test. (The advantage of having an interactive statistics program such as R in front of you is that, within ten seconds of thinking of it, you can have the results.) Because of the obvious difference in the variability, I am not going to pool the variances. Also, to be fair to the lunatics, er, I mean, the full moon believers in the crowd, I'm going to use a one-tailed test, since the lunatic hypothesis is MORE births on days with a full moon.
> t.test(births ~ fmoon, data=moon, alternative="less")

	Welch Two Sample t-test

data:  births by fmoon
t = -1.5663, df = 12.245, p-value = 0.07138
alternative hypothesis: true difference in means is less than 0
95 percent confidence interval:
     -Inf 40.77836
sample estimates:
 mean in group no mean in group yes
         9122.306          9422.083
Why "less" as the alternative hypothesis? R will see the levels of the fmoon factor, "yes" and "no", in alphabetical order, and when it subtracts the means, it will subtract the one that comes first in the alphabet (the "no" mean) minus the one that comes second (the "yes" mean). We're testing the alternative hypothesis that the "no" mean is lower than the "yes" mean, hence "less."
The difference in the group means is almost exactly 300 births per day. I would point out that spread over 500 or so birthing centers in the U.S., that's less than one additional birth per birthing center. Still, the difference is very nearly statistically significant, p = 0.071.
What is the p-value if a pooled-variance t-test is done?
What could be the cause of the nearly significant difference (three things)?
> sum(moon$fmoon == "yes")
[1] 12
The expression moon$fmoon == "yes" evaluates to TRUE or FALSE for every value of fmoon (every day of the year). The sum() function then counts up the TRUEs. So there were only 12 full moon days in 1978. Furthermore, there are other factors that affect birthrate, and suppose fmoon is confounded with one or more of those. For example, there are fewer births on weekends and on holidays, as we'll soon see. Suppose those 12 full moon days all fell on weekdays that were not holidays. Then accounting for the effect of weekends and holidays could make the full moon effect we are (almost) seeing go away. Of course, if there were an excessive number of weekends and holidays on full moon days, then accounting for the effect of weekends and holidays could make the full moon effect bigger. (Make sure you understand this. If a lot of full moons occurred on weekends and holidays, and fewer births occur on weekends and holidays, then the full moon effect is being penalized because of the number of full moons that occurred on otherwise low birthrate days. And vice versa.)
> tapply(moon$births, moon$holiday, mean)
      no      yes
9150.649 8026.000
The holiday effect is BIG! The mean number of births drops by over 1000 on holidays, which is a drop of over 12%. We're going to have to keep an eye on those holidays!
> with(moon, table(holiday, fmoon))
       fmoon
holiday  no yes
    no  347  12
    yes   6   0
There you go! All 12 full moons occurred on nonholidays. We have a confound, and it's not looking good for the full moon effect. Let's look at the effects of month and weekday on births.
> par(mfrow=c(2,1))   # two rows of graphs, one graph per row
> boxplot(births ~ weekday, data=moon)
> boxplot(births ~ month, data=moon)
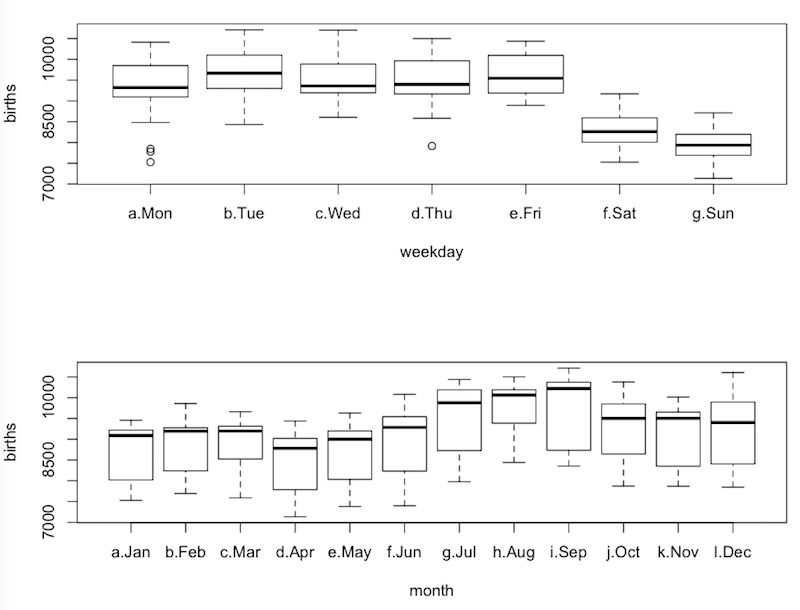
We can see that the birthrate drops quite a lot on Saturdays and Sundays. We also see that July, August, and September are high birthrate months, and January through about May are low birthrate months.
Could "fmoon" be confounded with "month"?
Could "fmoon" be confounded with "weekday"?
If full moons occurred on weekends in 1978, then the full moon effect is being strongly penalized because of that.
> with(moon, table(wkend, fmoon))
     fmoon
wkend  no yes
  no  250  10
  yes 103   2
What we see, however, is the opposite. Fewer full moons occurred on weekends than we might expect. When this is taken into account, it should diminish any full moon effect even further.
Why do you think the birthrate starts to rise in June and is high in July, August, and September?
Why do you think the birthrate is low on weekends?
Are you beginning to see the makings of a regression analysis here? Obviously, the effects of "holiday" and "weekday" should be taken out BEFORE we look at the effect of "fmoon" so as to remove any confound. We can also use "month" as a covariate (albeit a nonnumeric one) to remove as much irrelevant variability from the birthrate as possible. Let's do a quick regression (it will not be the final one) to see what there is to see.
> lm.moon = lm(births ~ month + wkend + holiday + fmoon, data=moon)
> summary(lm.moon)

Call:
lm(formula = births ~ month + wkend + holiday + fmoon, data = moon)

Residuals:
    Min      1Q  Median      3Q     Max
-1659.9  -168.4    -1.3   183.1  1320.6

Coefficients:
            Estimate Std. Error t value Pr(>|t|)
(Intercept)  9186.87      51.06 179.932  < 2e-16 ***
monthb.Feb    140.50      72.57   1.936  0.05366 .
monthc.Mar     99.44      70.72   1.406  0.16057
monthd.Apr   -229.66      71.30  -3.221  0.00140 **
monthe.May    -42.16      70.62  -0.597  0.55087
monthf.Jun    214.71      71.30   3.012  0.00279 **
monthg.Jul    820.32      70.62  11.617  < 2e-16 ***
monthh.Aug    944.95      70.72  13.363  < 2e-16 ***
monthi.Sep   1079.43      71.19  15.162  < 2e-16 ***
monthj.Oct    544.43      70.71   7.700 1.41e-13 ***
monthk.Nov    391.30      71.20   5.496 7.50e-08 ***
monthl.Dec    505.03      70.62   7.152 5.04e-12 ***
wkendyes    -1423.96      32.26 -44.141  < 2e-16 ***
holidayyes  -1382.53     115.50 -11.970  < 2e-16 ***
fmoonyes      100.18      81.73   1.226  0.22110
---
Signif. codes:  0 '***' 0.001 '**' 0.01 '*' 0.05 '.' 0.1 ' ' 1

Residual standard error: 278 on 350 degrees of freedom
Multiple R-squared:  0.8889,	Adjusted R-squared:  0.8845
F-statistic: 200.1 on 14 and 350 DF,  p-value: < 2.2e-16
What is this result telling us? First of all, our predictors are all categorical, so why are we not doing an ANOVA here?
> with(moon, table(wkend, holiday, fmoon))
, , fmoon = no

     holiday
wkend  no yes
  no  245   5
  yes 102   1

, , fmoon = yes

     holiday
wkend  no yes
  no   10   0
  yes   2   0
And there's the answer. Some of the cells are empty and others are very small. That would make the ANOVA at the very least a headache. The regression analysis doesn't mind so much. (It's not ideal, but it's what we have, so we live with it.) So back to the regression output.
What percentage of the total variability in births is being accounted for by this model?
Is this a significant part of the variability? Cite a statistical test.
What is a typical prediction error made by this model?
Half of the prediction errors made by this model are between what two values?
The intercept is 9186.87. What is that?
Cutting to the chase, what is the coefficient for fmoon and what does it mean?
What is another way to say this?
Is this effect of a full moon statistically significant? Cite a statistical test.
Interpret the coefficient labeled wkendyes.
The effect of "holidayyes", which is to say holiday=yes, is -1382.53. In other words, if the day is one of the six holidays we coded as "yes", but is not a weekend day or a full moon day, then the predicted (or mean) number of births decreases from the intercept value by 1382.53. In yet other words, the mean number of births on holidays in January that were not weekend days or full moon days is predicted to be 9186.87 - 1382.53 = 7804.34. That coefficient is significantly different from zero, p < 0.001.
There is a holiday in January. What were the number of births on that day and what is the residual for that day?
Hold on! That's the wrong answer. Did you catch it?
Is the model predicting too low or too high for New Years Day?
Hold it! There is only one case of both holiday and weekend day. Why can't our model predict that perfectly if there is only ONE case, for crying out loud?
The reason the observed value of 7701 is not the same as the predicted value of 6380.36, even though there was only one case of holiday and weekend, is because the prediction is for a hypothetical population of days. The prediction gives the predicted mean of a hypothetical population of days that are both weekend days and holidays, but not full moon days. If you got that one, congratulations! That one even tricked me for a minute.
We don't have any days in our sample of days in which "wkend", "holiday", and "fmoon" were all "yes". Nevertheless, we can make a prediction for such a day. Let's say that day is in March.
What is the coefficient for monthsc.Mar and what does it mean?
What is the prediction for a day in March which is a weekend, is a holiday, and on which there is a full moon?
Can we calculate a residual for such a day?
> confint(lm.moon)
                   2.5 %      97.5 %
(Intercept)  9086.452959  9287.28917
monthb.Feb     -2.224257   283.23291
monthc.Mar    -39.644635   238.51612
monthd.Apr   -369.889916   -89.42329
monthe.May   -181.043176    96.72308
monthf.Jun     74.489751   354.93552
monthg.Jul    681.438209   959.20447
monthh.Aug    805.871494  1084.03225
monthi.Sep    939.406784  1219.45129
monthj.Oct    405.373256   683.49574
monthk.Nov    251.268308   531.32566
monthl.Dec    366.147887   643.91414
wkendyes    -1487.407453 -1360.51548
holidayyes  -1609.687945 -1155.37313
fmoonyes      -60.556440   260.91800
With 95% confidence, we can say the effect of full moon in a hypothetical population of full moon days is between what two values?
Gee! So that means we cannot be confident that the effect of a full moon is not zero. Correct?
Hopefully, you recall one of King's laws of statistics: not significantly different does not mean not different. Just because we didn't find any convincing evidence of the effect does not mean the effect doesn't exist. But a look at the confidence interval for the fmoon coefficient shows us that zero is included in that interval, meaning we cannot be confident that the true value of the coefficient isn't zero. Furthermore, zero is not near the lower or upper limit of the confidence interval. In other words, it wasn't even close!
Most people don't see the full moon as occurring on one particular day. If they go outside and see a big, shiny, nearly round moon, that moon is full. Astronomically, the full moon not only occurs on a given day but at a given second of that day. That's not the way most people see it.
It might be interesting, therefore, to see if births are elevated on days that are near full moon, say within two days, and that is the point of the "dyaway" variable. We look at both boxplots and means.
> boxplot(births ~ dyaway, data=moon)
> with(moon, tapply(births, dyaway, mean))
       0        1        2        3        4        5        6        7        8        9
9422.083 9212.208 9081.708 9151.042 9187.250 9086.917 9206.458 9218.240 9132.400 8981.880
      10       11       12       13       14       15
9138.680 9051.560 8961.160 9121.577 9164.231 9204.429
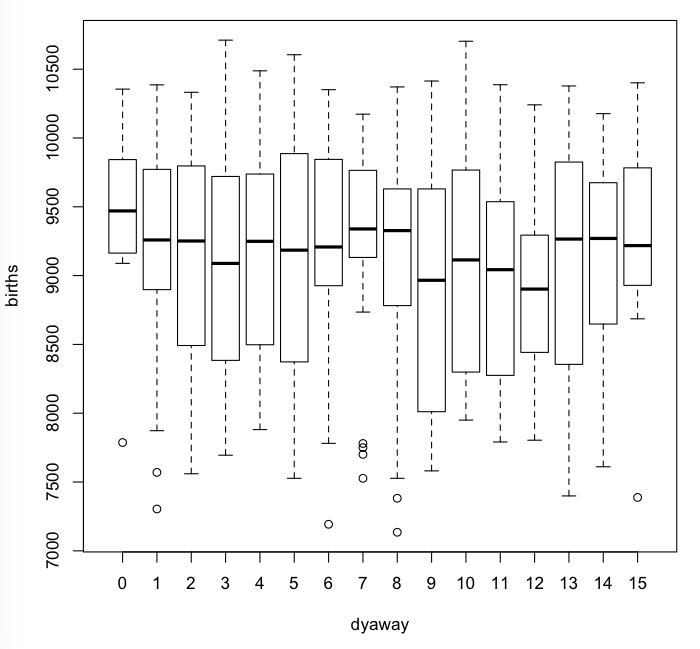
It's interesting that the birthrate for day 0, the actual full moon day, has the highest of the medians in the boxplots and the highest of the means. But the days surrounding full moon, days 1 and 2, don't appear to be exceptional.
Let's try something, while we're on this fishing expedition!
> summary(aov(births ~ dyaway, data=moon))
             Df    Sum Sq Mean Sq F value Pr(>F)
dyaway        1    599295  599295   0.896  0.345
Residuals   363 242891628  669123
Have I finally convinced you that the full moon, or phase of the moon, has no effect on birthrate?
Seriously though, how could the phase of the moon possibly have an effect on birthrate? Tell me how that would work. Well, some of the fruitcakes on the Internet say it's a tidal effect. The moon moves the oceans to create tides, after all. Surely, it can have a similar tidal effect on childbirth. Is that a reasonable explanation?
Let's take a little side trip on our fishing expedition. Back in the 1950s (which was not so long ago for some of us!), behavior geneticists started claiming there were genetic effects on all kinds of psychological variables, i.e., that psychological traits are heritable. The skeptics would roll their eyes and say, "How is that possible? How is it possible for genes to have an effect on psychology?" The observational studies of human behavior geneticists weren't very good back in the 1950s. They lacked a number of essential controls. They are much, much better today, and we are still seeing the same effects. So the answer to those critics today would be, "We don't know. We haven't found the genes for (fill in your favorite psychological variable here), but we know they exist. The effect is real, even if we can't explain it. We've convincingly demonstrated the effect statistically."
The same argument would have to apply to the full moon effect. If we can convincingly demonstrate it's existence statistically, then it exists whether we can explain it or not. So far, however, we've crapped out on that, so let's get a little more serious.
I propose a hierarchical regression in four steps, because I want to see just how much of the variability in births is being "explained" at each of these steps. I propose the following.
Let's do it!
> lm.0 = lm(births ~ 1, data=moon)
> lm.1 = lm(births ~ month, data=moon)
> lm.2 = lm(births ~ month + weekday, data=moon)
> lm.3 = lm(births ~ month + weekday + holiday, data=moon)
> lm.4 = lm(births ~ month + weekday + holiday + dyaway, data=moon)
It's done! The effect of moon phase, if any, is waiting for us in our workspace.
> anova(lm.0)   # to get SS.Total
Analysis of Variance Table

Response: births
           Df    Sum Sq Mean Sq F value Pr(>F)
Residuals 364 243490923  668931
>
> SS.Total = 243490923   # save it
>
> anova(lm.0, lm.1)   # the effect of month
Analysis of Variance Table

Model 1: births ~ 1
Model 2: births ~ month
  Res.Df       RSS Df Sum of Sq     F    Pr(>F)
1    364 243490923
2    353 186880865 11  56610058 9.721 2.112e-15 ***
---
Signif. codes:  0 '***' 0.001 '**' 0.01 '*' 0.05 '.' 0.1 ' ' 1
What is delta R-squared (R2 change) due to "month"?
Is that significantly different from 0? Cite a relevant statistical test.
Onward!
> anova(lm.1, lm.2)   # the effect of weekday after month is removed
Analysis of Variance Table

Model 1: births ~ month
Model 2: births ~ month + weekday
  Res.Df       RSS Df Sum of Sq      F    Pr(>F)
1    353 186880865
2    347  31743263  6 155137602 282.65 < 2.2e-16 ***
---
Signif. codes:  0 '***' 0.001 '**' 0.01 '*' 0.05 '.' 0.1 ' ' 1
What is delta R-squared due to "weekday"?
Is that significantly different from 0? Cite a relevant statistical test.
What is multiple R-squared at this point in our regression?
Next step!
> anova(lm.2, lm.3)   #the effect of holiday after month and weekday are removed
Analysis of Variance Table

Model 1: births ~ month + weekday
Model 2: births ~ month + weekday + holiday
  Res.Df      RSS Df Sum of Sq      F    Pr(>F)
1    347 31743263
2    346 21833580  1   9909683 157.04 < 2.2e-16 ***
---
Signif. codes:  0 '***' 0.001 '**' 0.01 '*' 0.05 '.' 0.1 ' ' 1
What is delta R-squared due to "holiday"?
Is that significantly different from 0? Cite a relevant statistical test.
What is multiple R-squared at this point in our regression?
And now the one we've been waiting for!
> anova(lm.3, lm.4)   # the effect of dyaway after month, weekday, and holiday are removed
Analysis of Variance Table

Model 1: births ~ month + weekday + holiday
Model 2: births ~ month + weekday + holiday + dyaway
  Res.Df      RSS Df Sum of Sq      F  Pr(>F)
1    346 21833580
2    345 21481414  1    352166 5.6559 0.01794 *
---
Signif. codes:  0 '***' 0.001 '**' 0.01 '*' 0.05 '.' 0.1 ' ' 1
What is delta R-squared due to "dyaway"?
So moon phase is accounting for what percentage of the variability in birthrate?
Is that significantly different from 0? Cite a relevant statistical test.
What is multiple R-squared at this point in our regression?
Betcha didn't expect that! I didn't either. I'm interested in seeing the coefficient for dyaway. (It's a big output, so look at it on your own screen. I'll just show the one relevant line.)
> summary(lm.4)
              Estimate Std. Error t value Pr(>|t|)
dyaway          -7.268      3.056  -2.378 0.017941 *
How should we interpret that coefficient?
> confint(lm.4)   # only showing one line of the output
                   2.5 %       97.5 %
dyaway         -13.27812    -1.257054
It's certainly a small effect, but we seem to be reasonably confident that it is not zero. Why is it not zero? (Three possible reasons.)
Have we proven that there is a full moon effect on birthrate?
Have we convincingly demonstrated the effect statistically?
We've wrung these data out like a wet towel! We've been on a massive fishing expedition. If I wanted to be polite, I might call it an "exploratory data analysis." Exploratory data analysis generates hypotheses, it does not confirm them. It gives us something to look for, it does not tell us it's there.
Suppose you believe, as tiny as it is, that the full moon effect is real. How would you go about convincing me of it? You could combine 10 years of data into a single analysis, but there is a problem with that if birth rates are changing over years. Here's what I would do. I would look at a large number of years individually. The full moon effect may be small and even nonsignificant in any one of them, but if the small effect occurs over and over and over, year after year after year, in other words, if it replicates, then sooner or later people will have to admit that it's a real effect. (Provided what? That we've accounted for all possible confounds. Confounds replicate, too!)
At this point, would we have convincingly demonstrated the effect statistically?
Remember the movie Moonstruck? (Ooh, good movie. You should see it if you haven't.) What is the song Dean Martin sang? "When the moon hits your eye like a big pizza pie, that's amore." Maybe it's some other aspect of human behavior that is being affected by moon phase. Maybe people find the full moon romantic and conceive a lot of babies at full moon. Then 280 days later... Okay, that doesn't track. 280 days is nine and a half full moons later. If this is correct, then the birthrate should spike around new moon. In fact, there is a little peak in the means there, but it's nowhere near the size of the peak at full moon.
Other questions we might want to ask concern hormonal fluctuations during the lunar cycle (Hirshenhauser, et al., 2002, Monthly patterns of testosterone and behavior in prospective fathers, Hormones and Behavior, 42(2), 172-181). We know that light impacts the production of melatonin. Melatonin is produced in the dark, and a relationship has been reported between melatonin levels and sexual behavior, at least in rats (Brotto & Gorzalka, 2000, Melatonin enhances sexual behavior in the male rat, Physiology and Behavior, 68(4), 483-486). Interestingly, the first sentence of the abstract of this article is, "Anecdotal reports suggest that melatonin enhances libido in men." And so on.
You get the idea. There are a LOT of things that have to be accounted for.
If you decide to take on this problem, let me know. I'd be interested in hearing what you find.